How to evaluate Loki's cost on an installation
This document’s purpose is to help one evaluate the cost of a loki setup running on an installation.
Table of contents
Loki Cost Estimate dashboard
Open grafana on the installation you’re interested in and go to the dashboard section. There, open the Loki Cost Estimate dashboard and select the cluster and tenant or leave both to the default all value.
A lot of guidelines to evaluate Loki’s cost are given in the Explanation field of the dashboard so this section will not go into every details but will only mention the important things to consider.
Loki’s cost is coming from 3 different sources :
- The CPU & Memory consumption from all Loki’s and Promtail’s pods.
- The object storage cost.
- The data sent to the MC Loki by the promtail pods on WCs.
The dashboard gives access to graphs related to those sources :
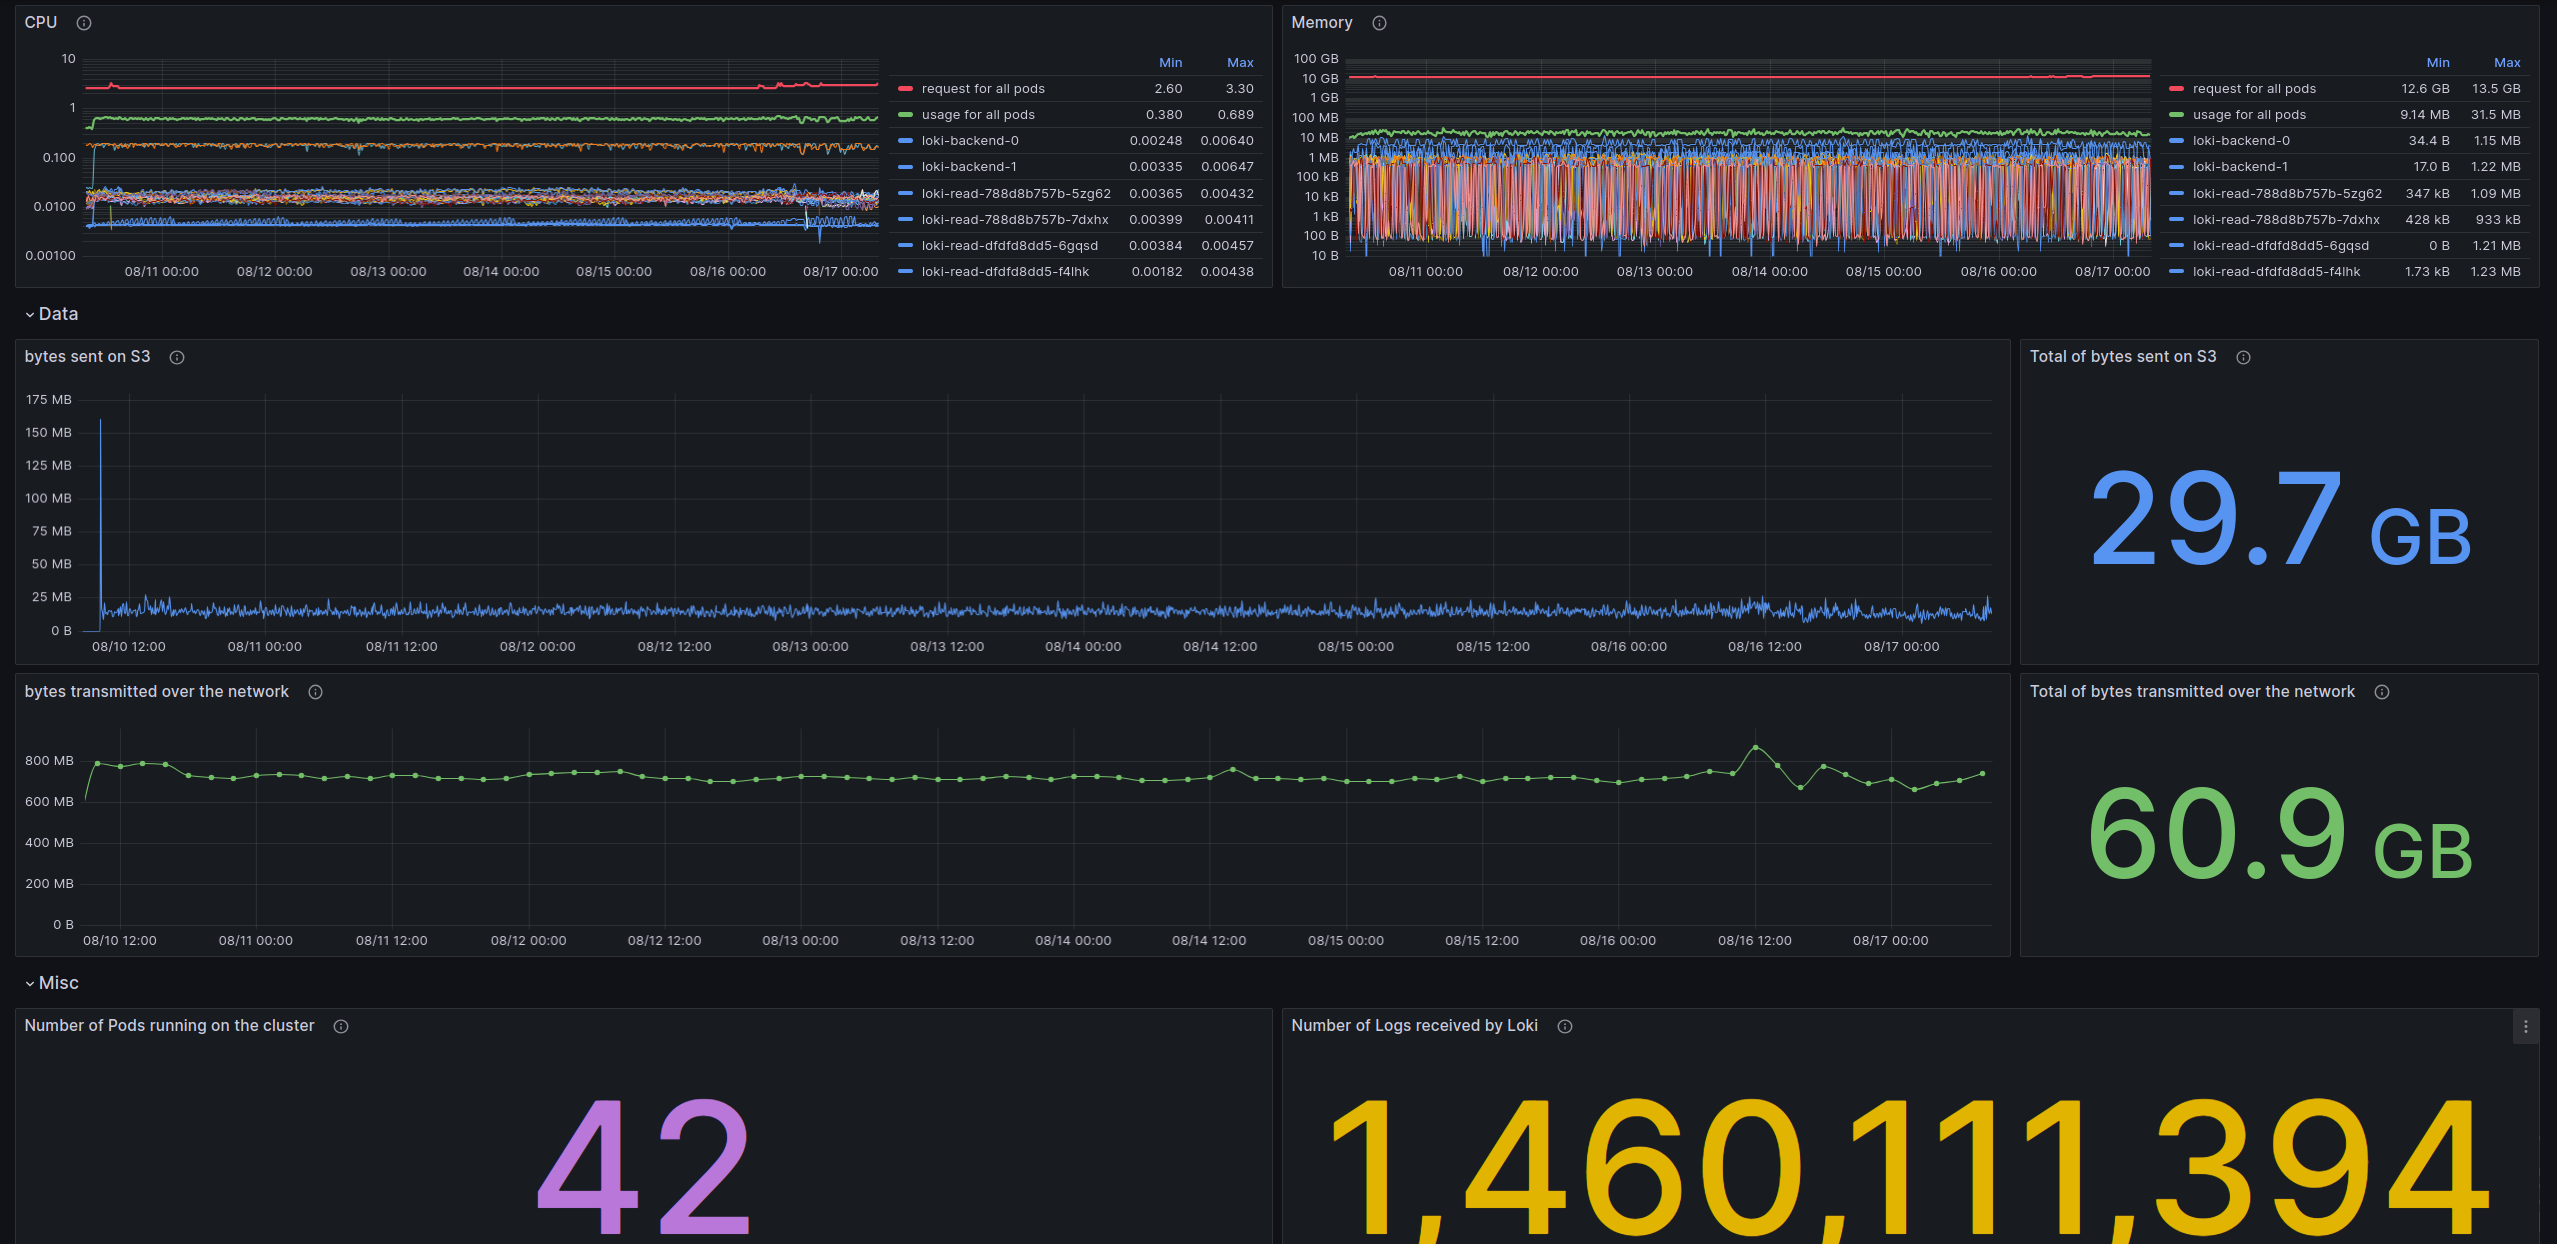
Basing on the total storage space used by Loki to store the logs as well as the base cost of the object storage service from your cloud-provider, one can roughly estimate the cost of storage for the logging-infrastructure.
Similar applies to the data sent to Loki by the promtail pods. If one knows the price for network traffic from the cloud-provider, one can estimate the corresponding cost from the Total of bytes transmitted over the network field of the dashboard.
CPU and memory cost are a bit more tricky to quantify, but it’s still possible to measure the increase in resource consumption in the clusters associated with Loki.
Using Cost Explorer (AWS only)
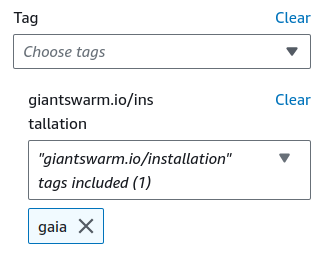
Alongside the dashboard mentioned above, if the logging infrastructure is running on an AWS installation, one can open the AWS console and navigate to the Cost Explorer service. There, select the time period to be evaluated as well as the tag giantswarm.io/installation with the value corresponding to the installation’s name:
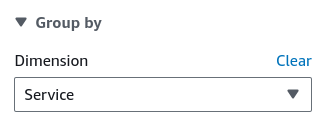
In addition to those parameters, one can increase the graph’s precision by grouping the result by services:
By selecting those parameters, one can generate a similar looking graph:
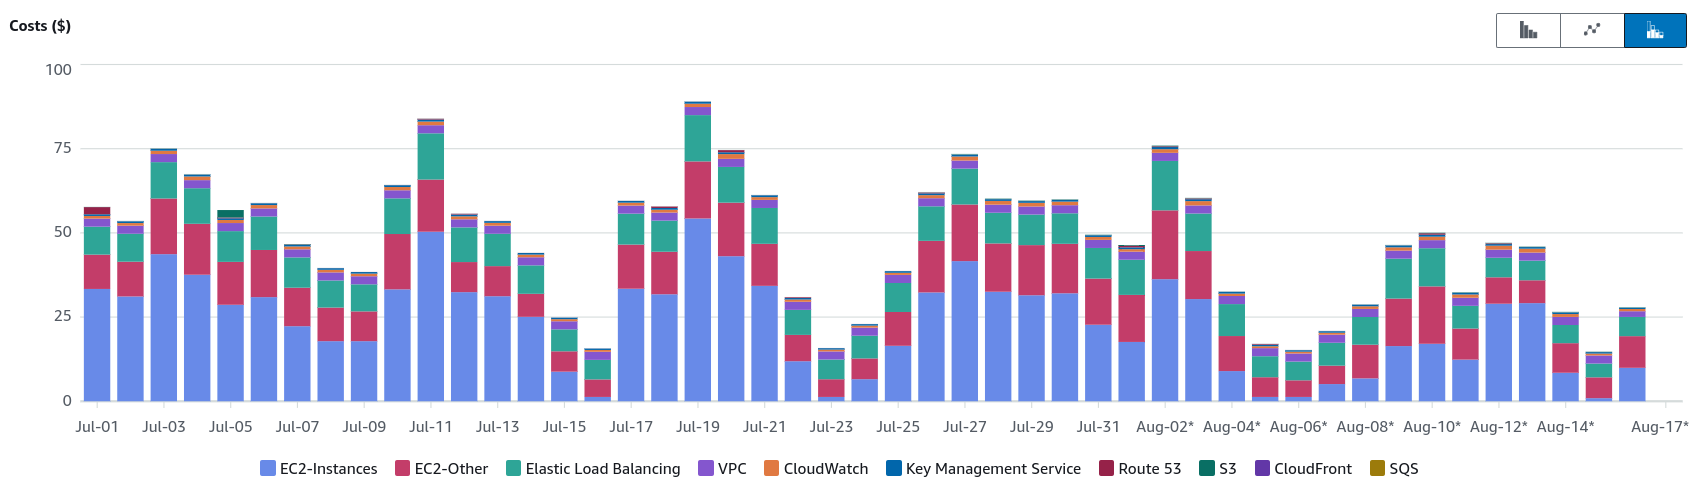
Using the graphs it’s possible to compare the general cost of the installation between time periods with or without enabled logging infrastructure.