Using Loki at GiantSwarm
Classification:
Context
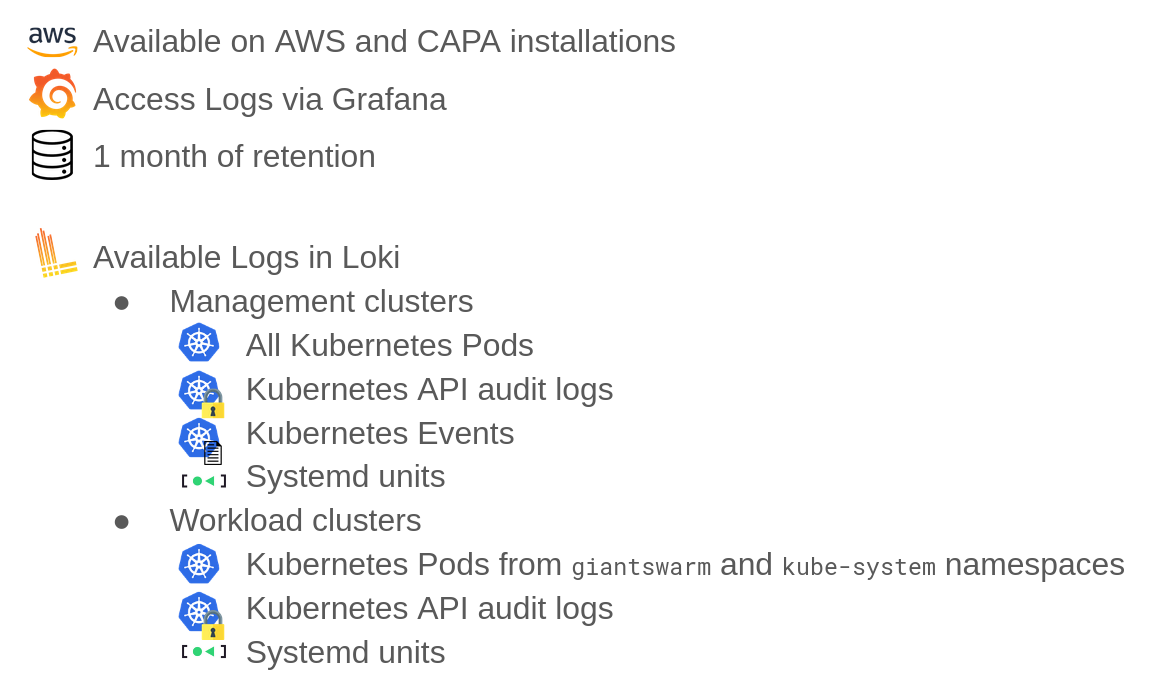
Logs, which are records of events and activities generated by systems and applications, serve as a rich source of information for administrators, developers, and security professionals. The ability to search through logs is essential to help with troubleshooting and debugging by looking through a detailed history of events, errors and warnings. It is also a valuable source of information in context of performance monitoring, security and compliance.
This guide provides you with the basics to get started with exploring Logs using the powerful capabilities brought by Grafana and Loki.
How to access Logs ?
- Open your installation’s Grafana
- via UI: https://docs.giantswarm.io/tutorials/observability/data-exploration/accessing-grafana/
- via CLI (giantswarm only):
opsctl open -i myInstallation -a grafana
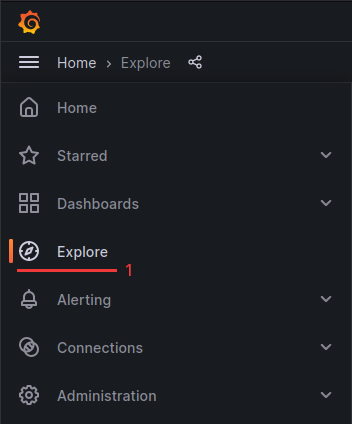
- Go to
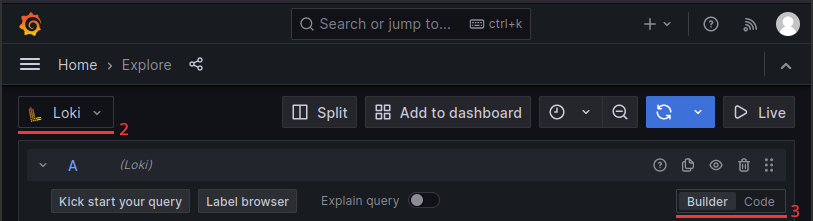
Exploreitem in theHomemenu - Select
Lokidatasource on the top left corner - Choose how to build your queries:
builderand play with the dropdowns to build your querycodeto write your query using LogQL
Live Mode
Live mode feature of Grafana Loki is not available at the moment because of multi-tenancy (c.f. https://github.com/grafana/loki/issues/9493) 😢
LogQL basics
Query anatomy
Log stream selectors
Used to filter the log stream by labels
=  : equals
!= : not equals
=~ : regex matches
!~ : regex does not match
Filter operators
Used to filter text within the log stream
|= : contains
!= : does not contain
|~ : regex matches
!~ : regex does not match
Example of useful LogQL queries
Here are a few LogQL queries you can test and play with to understand the syntax.
Basic pod logs
- Look for all
k8s-api-serverlogs onmyInstallationMC:
{installation="myInstallation", cluster_id="myInstallation", pod=~"k8s-api-server-ip-.*"}- Let’s filter out “unable to load root certificate” logs:
{installation="myInstallation", cluster_id="myInstallation", pod=~"k8s-api-server-ip-.*"} != "unable to load root certificate"- Let’s only keep lines containing “url:/apis/application.giantswarm.io/.*/appcatalogentries” (regex):
{installation="myInstallation", cluster_id="myInstallation", pod=~"k8s-api-server-ip-.*"} |~ "url:/apis/application.giantswarm.io/.*/appcatalogentries"json manipulation
- With json logs, filter on the json field
resourcecontents:
{installation="myInstallation", cluster_id="myInstallation", pod=~"prometheus-meta-operator-.*"} | json | resource=~"remotewrite.*"- from the above query, only keep field
message:
{installation="myInstallation", cluster_id="myInstallation", pod=~"prometheus-meta-operator-.*"} | json | resource=~"remotewrite.*" | line_format "{{.message}}"Audit logs
- Get audit logs using json filter to get only the ones owned by a specific user
{cluster_id="myCluster",scrape_job="audit-logs"} |= `` | json | user_username=`fernando@giantswarm.io`Note: In json filter to access nested properties you use _ for getting a child property as the example above (user.username -> user_username).
System logs
- Look at
containerdlogs for node10.0.5.119onmyInstallationMC:
{installation="myInstallation", cluster_id="myInstallation", systemd_unit="containerd.service", node_name="ip-10-0-5-119.eu-west-1.compute.internal"}Metrics queries
You can also generate metrics from logs.
- Count number of logs per node
sum(count_over_time({installation="myInstallation", cluster_id="myInstallation", node_name=~"ip-.*"}[10m])) by (node_name)- Top 10 number of log lines per scrape_job, app, component and systemd_unit /!\ This query is heavy in terms of performance, please be careful /!\
topk(10, sum(rate({cluster_id="myCluster"}[5m])) by (cluster_id, scrape_job, app, component, systemd_unit))- Rate of logs per syslog identifier /!\ This query is heavy in terms of performance, please be careful /!\
sum(rate({cluster_id="myCluster", scrape_job="system-logs"}[5m] |= `` | json)) by (SYSLOG_IDENTIFIER)